![]()
Low-resource sFlow monitoring for high-traffic networks, with PRTG
- Monitor all your sFlow data from one place
- Get alerted promptly in case of performance issues
- Works with any sFlow-compatible device
Our users give top ratings for monitoring with Paessler PRTG


PRTG sFlow monitoring: What you’ll find on this page

PRTG makes sFlow monitoring easy
Custom alerts and data visualizations make it easy to monitor, identify, and prevent traffic bottlenecks, packet loss, and other network performance issues.
Go with the sFlow
If you're running a busy network, monitoring traffic can feel like trying to count every single car passing through an intersection during rush hour. Chances are, instead of helping it work more efficiently, the juice you need to power your monitoring tools might end up contributing to it crashing.
Paessler PRTG's sFlow monitoring packs the depth of capabilities you'd expect from a top-of-the-range tool in a low-resource, easy-to-use, scalable solution. Keep an eye on network performance stats, troubleshoot issues, and make sure traffic keeps flowing freely, without straining your already limited resources.
3 reasons to use PRTG as your sFlow monitoring tool
Comprehensive solution
No more fiddling about with standalone sFlow collectors, viewers, and analyzers. PRTG is your comprehensive network monitoring tool, giving you a single, unified view.
Plus, it works with any sFlow-compatible device, including devices made by Alcatel-Lucent Enterprise, Cisco, Dell, HPE, and Netgear.
Continuous monitoring
Keep an eye on your network 24 hours a day, 7 days a week. PRTG doesn't take holidays, sick days, or sleep breaks.
Which means you can do so, safe in the knowledge PRTG automatically alerts you about network problems and protocol errors by email, push notification, SMS, and other methods – often before costly failures occur.
Effortless optimization
Keeping your network in top shape has never been easier. PRTG puts key performance stats at your fingertips, empowering you to allocate resources more efficiently, improve security, and make short work of any issues that are draining your resources.
Easily detect, for example, bandwidth bottlenecks, reduce unnecessary traffic, and accelerate business processes and maximize service availability through bandwidth optimization.
What sFlow monitoring looks like in PRTG
Diagnose network issues by continuously monitoring bandwidth usage, data traffic, and other network activities. Show bandwidth eaters in real time and visualize data in graphic maps & dashboards to identify problems more easily. Gain the visibility you need to troubleshoot performance problems and optimize your network.

Device tree view of the complete monitoring setup
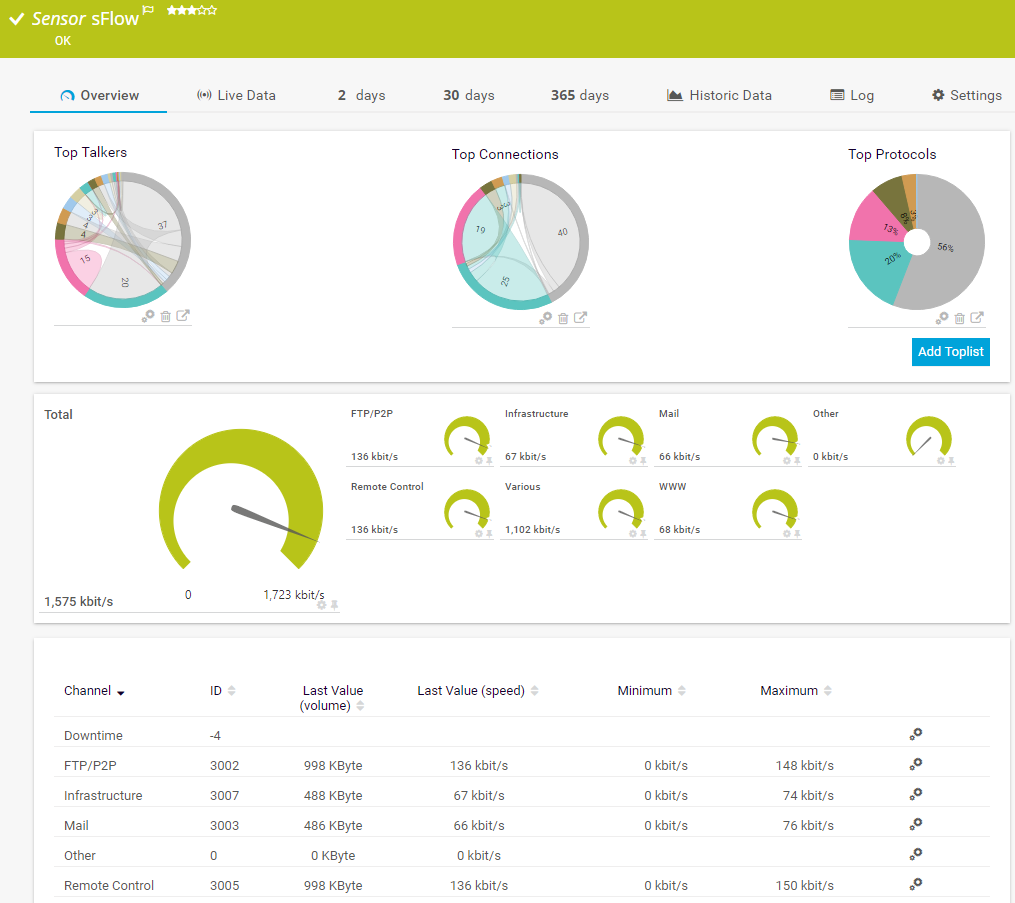
sFlow sensor in PRTG
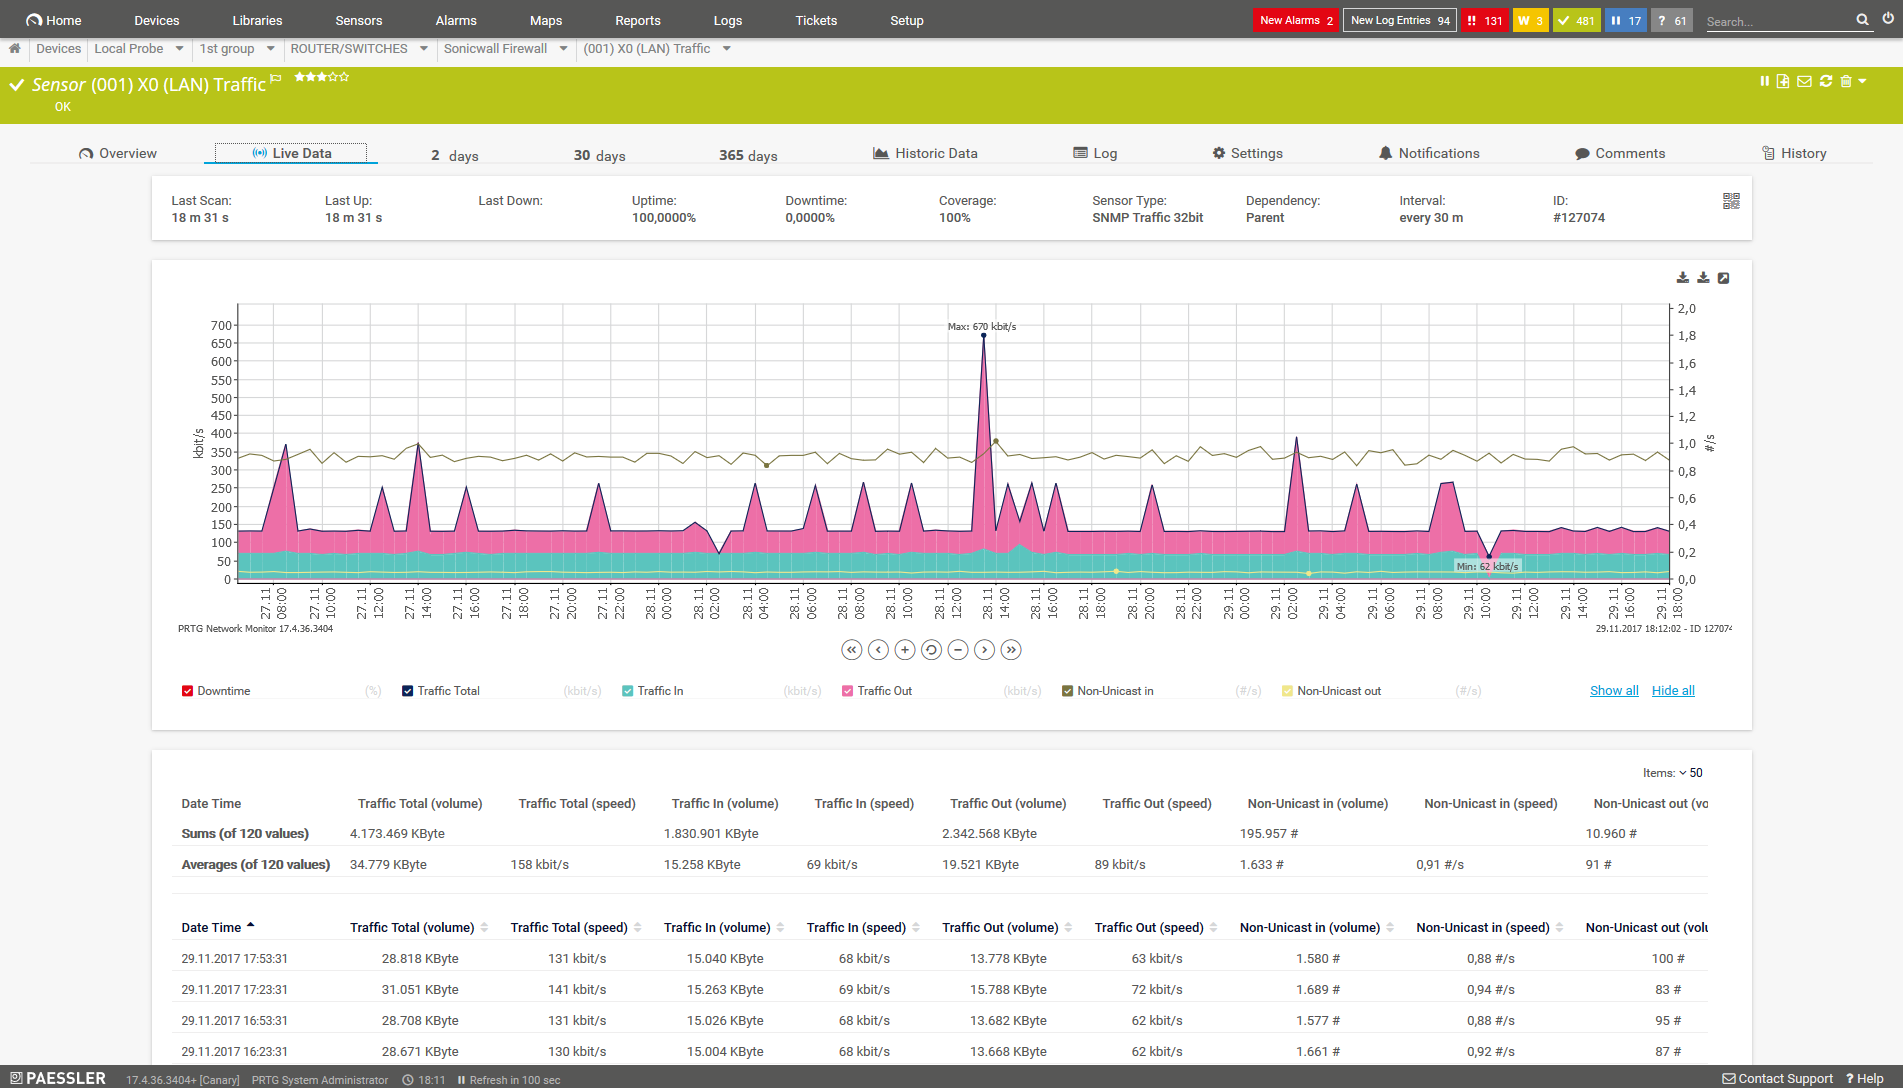
PRTG graph showing live traffic data
Start sFlow monitoring with PRTG and see how it can make your network more reliable and your job easier.
“All-around winning “The real beauty of PRTG is the endless possibilities it offers” “PRTG Network MonitorIT experts agree: Paessler PRTG is a great solution for IT infrastructure monitoring

network monitor”

is very hard to beat”
How it works: sFlow monitoring with PRTG in action
PRTG's sophisticated, preconfigured flow sensor types show you the following key pieces of data:
Bandwidth use per individual connection, and across the entire network
Root causes of traffic filtered by IP address, port, and protocol
Toplists that show you the main sources of traffic on your network over time
sFlow
Our sFlow sensor sorts traffic into standard categories: web, FTP, mail, chat, remote control applications, infrastructure, NetBIOS, Citrix, and others. It also lets you view the top talkers, connections, protocols in your entire network.
sFlow (Custom)
You can use the sFlow (Custom) sensor to sort data into categories of your choosing – handy if you want to monitor or analyze a specific traffic source or target.
PRTG is compatible with all major vendors, products, and systems
![]()
Your sFlow monitor at a glance – even on the go
Set up PRTG in minutes and use it on almost any mobile device.


Easily find the source of the problem with PRTG sFlow monitoring solution
Real-time alerts and custom notifications make it easy to solve issues such as bandwidth hogs, packet loss, and other network performance issues.
Create innovative solutions with Paessler’s partners
Partnering with innovative vendors, Paessler unleashes synergies to create
new and additional benefits for joined customers.


UVnetworks
UVexplorer integrates tightly with PRTG to bring fast and accurate network discovery, detailed device inventory, and automatic network mapping to the PRTG platform.
“Excellent tool for detailed monitoring. Alarms and notifications work greatly. Equipment addition is straight forward and server initial setup is very easy. ...feel safe to purchase it if you intend to monitor a large networking landscape.”
Infrastructure and Operations Engineer in the Communications Industry, firm size 10B - 30B USD
PRTG makes sFlow monitoring easy
Custom alerts and data visualizations make it easy to monitor, identify, and prevent traffic bottlenecks, packet loss, and other network performance issues.
Monitor with sFlow: FAQ
What is sFlow?
sFlow is a sampling technology for network monitoring invented by InMon. It works similarly to Cisco’s NetFlow and was first introduced by HPE in 2001. It stands for “sampled flow,” and uses statistical samples of data traffic to ensure scalability for interfaces with large amounts of data.
sFlow is designed to monitor network traffic with minimal impact on scarce resources. It does this by analyzing random samples of traffic instead of capturing every packet. sFlow's default sampling rate is 8192, but we recommend adjusting it to suit your network's requirements. The lower the sampling rate, the lighter the load (and vice versa, of course).
What is sFlow monitoring?
sFlow monitoring is a network monitoring technology used to capture and analyze traffic data in real-time. It operates by sampling packets flowing through network devices, such as switches and routers, to provide insights into network traffic patterns and performance. Unlike traditional methods that inspect every packet, sFlow uses statistical sampling to efficiently monitor network traffic without overwhelming the monitoring system.
It collects key information about network traffic, including source and destination IP addresses, protocols, and traffic volumes, enabling network administrators to identify anomalies, troubleshoot issues, and optimize network performance. sFlow is widely used in large-scale networks for its scalability and low overhead.
Why use an sFlow monitoring tool?
The biggest benefit of sFlow monitoring is that it keeps CPU load, bandwidth use, and memory utilization to an absolute minimum – great if your resources are limited or you operate in a sensitive environment. Of course, sFlow monitoring also has other compelling benefits. Having real-time visibility into your network's health makes it easier to allocate resources effectively, troubleshoot issues, and keep everything running smoothly.
sFlow vs NetFlow vs. IPFIX: What's the difference?
sFlow is based on NetFlow, but differs from it in two key ways. First, it's an open standard. And, second, it monitors random samples of data, while NetFlow monitors every packet. IPFIX is also an open standard based on NetFlow. But, where sFlow uses sampling, IPFIX is template-based (though it can be configured to work with random samples, too).
Whether your network has sFlow, NetFlow, or IPFIX-compatible devices (or a mix of all three), PRTG has you covered!
What is a sensor in PRTG?
In PRTG, “sensors” are the basic monitoring elements. One sensor usually monitors one measured value in your network, for example the traffic of a switch port, the CPU load of a server, or the free space on a disk drive.
On average, you need about 5-10 sensors per device or one sensor per switch port.

PRTG: The multi-tool for sysadmins
Adapt PRTG individually and dynamically to your needs and rely on a strong API:- HTTP API: Access monitoring data and manipulate monitoring objects via HTTP requests
- Custom sensors: Create your own PRTG sensors for customized monitoring
- Custom notifications: Create your own notifications and send action triggers to external systems
- REST Custom sensor: Monitor almost everything that provides data in XML or JSON format
More than just a monitoring tool:
Reasons our customers love PRTG


Paessler PRTG is used by companies of all sizes. Sysadmins love PRTG because it makes their job a whole lot easier. Bandwidth, servers, virtual environments, websites, VoIP services – PRTG keeps an eye on your entire network. Everyone has different monitoring needs. That’s why we let you try PRTG for free.Still not convinced?
![]()
More than 500,000
sysadmins love PRTG![]()
Monitor your entire IT infrastructure
![]()
Try Paessler PRTG
for free
![]()
Start sFlow monitoring with PRTG and see how it can make your network more reliable and your job easier.
|
PRTG |
Network Monitoring Software - Version 24.2.94.1424 (May 2nd, 2024) |
|
Hosting |
Download for Windows and cloud-based version PRTG Hosted Monitor available |
Languages |
English, German, Spanish, French, Portuguese, Dutch, Russian, Japanese, and Simplified Chinese |
Pricing |
Up to 100 sensors for free (Price List) |
Unified Monitoring |
Network devices, bandwidth, servers, applications, virtual environments, remote systems, IoT, and more |
Supported Vendors & Applications |
|
Combining the broad monitoring feature set of PRTG with IP Fabric’s automated network assurance creates a new level of network visibility and reliability.